When a student is dropped or withdrawn from a Laulima site, most of their work is "erased"* from the site, so data about the student is not readily available. If you are looking for simple information about the student such as when the last time they accessed the course or when they accessed x tool, you can use the Statistics tool.
1. The Statistics tool is not a default Laulima site tool, so first add the tool like you would any other tool, via the Site Info -> Manage Tools function.
2. After adding, click the Statistics tool:

3. When you open the Statistics tool, you will be on the Overview view and see several preset reports you can look at, as well as options along the top.

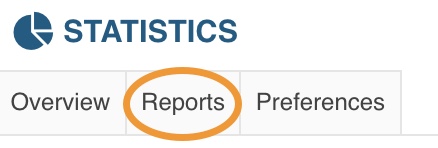
4. Since the student was taken out of the site, you will need to run a report query on all visitors to the site. To do this, click Reports along the top:

5. The Reports page displays some commonly run reports, but you can make a custom one by clicking Add under My Reports:

6. You can now add parameters to your report search. Optional: If you want to run this search again in the future, you can give it a title and save it at the end; it will be listed under My Reports on the Reports page:

7. Under What? leave it at Visits (there are also options for searching tools and events). Under When? You can choose a preset or custom range:

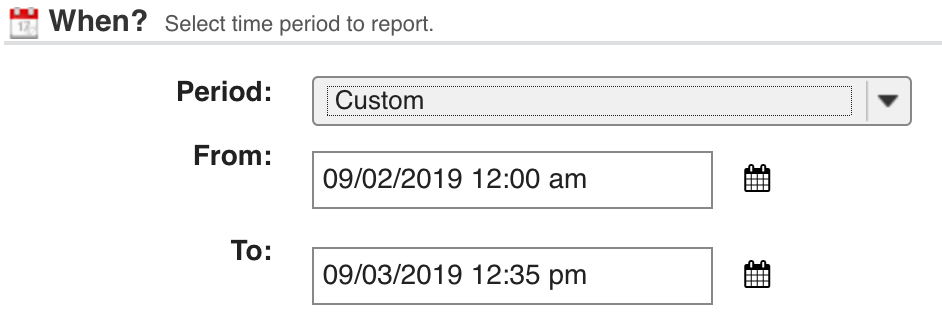
8. If you know when the student was taken out or just want to view a specific date range, under When? you can choose Custom and input the dates you want:

9. If the user is no long in the site, you will need to search all user visits, so under Who? leave it as All or if it is a student, click on the drop down menu and choose Role:

10. If you chose Role, you can then select Student (or whatever role you are looking for):

11. You are given options on how you want to display the report, but for this example just keep it at Table under How?. Click the Generate Report button:

12. Click the Generate Report button to see the results of your report (note: you can click to Save report if you want to save the parameters you chose for this report):

13. You will then see the results of the report. You can see for this example that the "when" was for one year, and the "who" was for students. The entire table is not visible here, but notice that if the student visited more once, it will show a date for each visit. You can sort by the User ID, Name, Event, Date, or Total by clicking on that type's head. Only the date is shown and number of visits that date, not the times on that date. Also you can see that there are more items in the table than what is displayed (in this case 1 to 20 out of 25), so if you want to see all entries you need to either click on the "Show" drop down menu or the next chevron (>) to go to the next page to see more:

14. You can also generate a report looking for a specific type of activity on step 7 (What?). Clicking the drop down under What? you are presented with two other options: Events and Resources:

15. Choosing Events, you can furthermore choose "Select by tool" which will provide you a list of most of the tools (a few tools are not supported such as Discussion and Private Messages) and using that as a parameter, you will get results of the students using that tool.

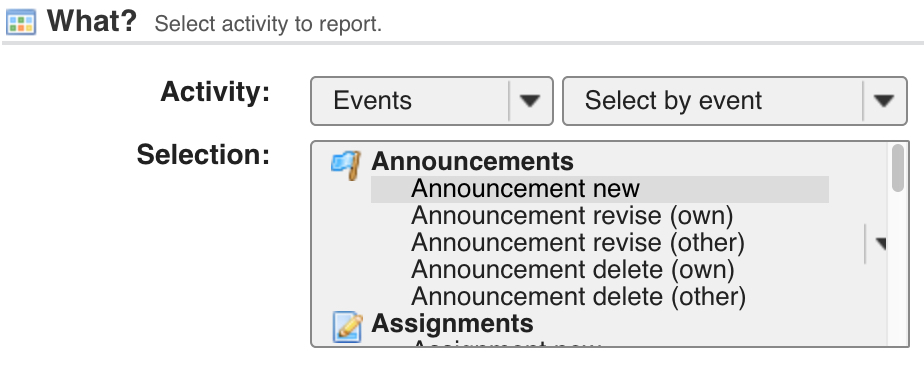
16. You can also choose "Select by event" under What? Events where you can search if they did a specific thing within one of the tools:

17. Resume generating your report from step 8.
* You can actually search for the dropped student only if you add them back in to the course. Note that this will bring back all of the student's submissions but also allows the student to access the course if it is published.