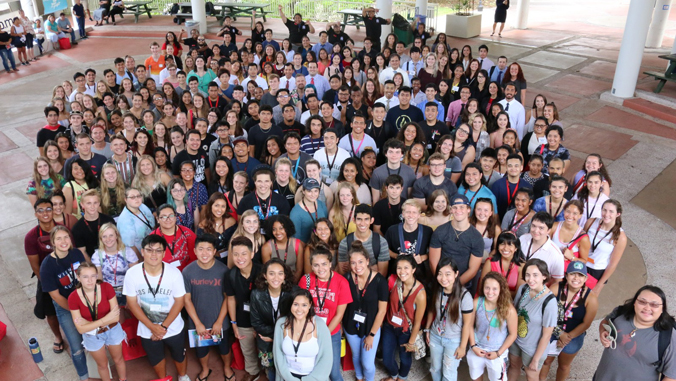
All University of Hawaiʻi campuses ranked in the top 10 in the U.S. for greatest racial and ethnic diversity among four-year and two-year institutions, according to The Chronicle of Higher Education’s 2018 Almanac diversity rankings.
UH Hilo ranked number one for the most diverse four-year public university in the nation. UH Maui College is third, UH West Oʻahu is fourth, and UH Mānoa is sixth.
The UH Community Colleges ranked as the top six most diverse two-year public institutions in the nation. Hawaiʻi CC ranked number one followed by Windward CC, Kauaʻi CC, Leeward CC, Honolulu CC and Kapiʻolani CC.
The diversity index indicates, on a scale of 1 to 100, the probability that any two students at an institution are from different racial or ethnic groups.
These are the top 10 most diverse public four-year universities and their corresponding diversity indexes:
- 1. UH Hilo, 88.9
- 2. Oklahoma State University Institute of Technology at Okmulgee, 87.1
- 3. UH Maui College, 86.5
- 4. UH West Oʻahu, 84.5
- 5. Highline College, 81.9
- 6. UH Mānoa, 81.6
- 7. California State University, East Bay, 79.3
- 8. Rutgers University-Newark, 78.9
- 9. New Jersey Institute of Technology, 78.5
- 10. Seattle Central College, 78.0
These are the top 10 most diverse public two-year colleges and their corresponding diversity indexes:
- 1. Hawaiʻi CC, 91.9
- 2. Windward CC, 91.5
- 3. Kauaʻi CC, 87.2
- 4. Leeward CC, 83.3
- 5. Honolulu CC, 79.6
- 6. Kapiʻolani CC, 79.0
- 7. Montgomery College, 78.4
- 8. Berkeley City College, 78.3
- 9. Bunker Hill Community College, 78.2
- 10. Solano Community College, 78.2
UH Hilo
Students reported being 20.6 percent Asian, 9.6 percent Native Hawaiian or Pacific Islander, 20.2 percent white and 31.2 percent of two or more races.
UH Maui College
Students are 27.9 percent Asian, 7.1 percent Native Hawaiian or Pacific Islander, 19.1 percent white and 31.1 percent are two or more races.
UH West Oʻahu
Students are 35.3 percent Asian, 6 percent Native Hawaiian or Pacific Islander, 10.8 percent white and 32.8 percent are two or more races.
UH Mānoa
Students are 36 percent Asian, 3.4 percent Native Hawaiian or Pacific Islander, 19.9 percent white and 23.2 percent are two or more races.
Hawaiʻi CC
Students are 18 percent Asian, 8 percent Native Hawaiian or Pacific Islander, 13.8 percent white and 42.6 percent are two or more races.
Windward CC
Students are 18.2 percent Asian, 6.9 percent Native Hawaiian or Pacific Islander, 15.5 percent white and 42.2 percent are two or more races.
Kauaʻi CC
Students are 28.9 percent Asian, 6.2 percent Native Hawaiian or Pacific Islander, 16.5 percent white and 34.9 percent are two or more races.
Leeward CC
Students are 37 percent Asian, 4.9 percent Native Hawaiian or Pacific Islander, 8.8 percent white and 31.3 percent are two or more races.
Honolulu CC
Students are 42.5 percent Asian, 6.5 percent Native Hawaiian or Pacific Islander, 8.1 percent white and 29 percent are two or more races.
Kapiʻolani CC
Students are 42.7 percent Asian, 2.7 percent Native Hawaiian or Pacific Islander, 10 percent white and 24.9 percent are two or more races.
A subscription is needed to see The Chronicle of Higher Education’s 2018 Almanac diversity rankings.

