Mapping rainfall in Hawai‘i is difficult!
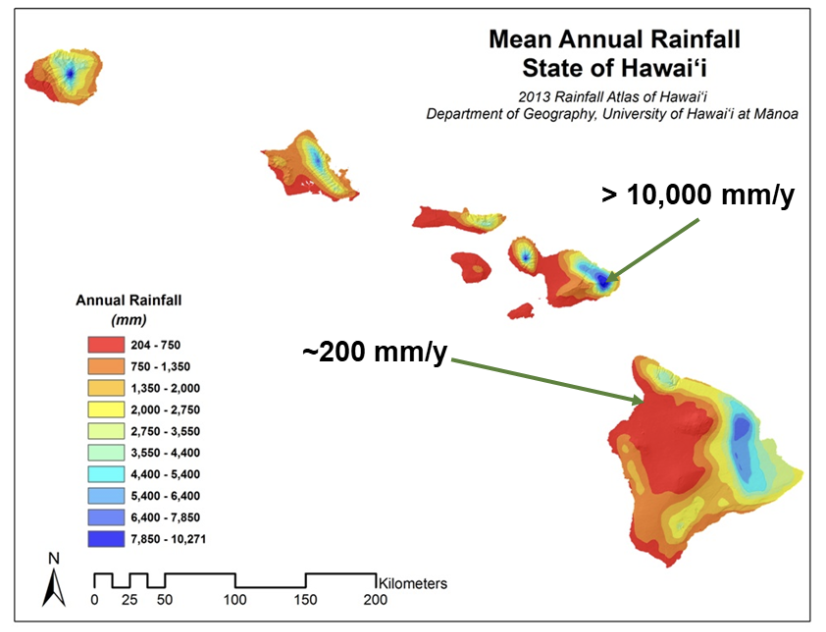
Given the complexity of the climate patterns in Hawai‘i, it is difficult to create gridded climate products (digital maps). The sharp horizontal differences in climate between leeward and windward exposures combined with the extreme vertical differences that arise due to differences in elevation and the presence of the trade wind inversion (TWI) affect all climate patterns in one way or another. It is remarkable that these differences occur over such short distances (Figure 1). Another complicating factor is the lack of measurements available for higher level climate data production and mapping techniques.
A History of Mapping Rainfall in Hawai‘i
The earliest known rainfall observations in Hawai‘i were taken by Dr. Thomas Charles Byde Rooke in 1837 at Nuʻuanu Avenue and Beretania Street in Honolulu. By the end of the 19th century, rainfall was being monitored at 106 stations. That number increased to 422 by 1920. As data accumulated and the number of observation sites expanded, various efforts were made to map the spatial patterns of rainfall. With each successive analysis, the resulting maps were refined and improved, taking advantage of a growing database and better understanding of the processes controlling rainfall. Differences among these maps reflect this refinement and improvement, as well as fluctuations in rainfall over time. The last known rainfall climatology was published in 2013 and utilized data from over 1000 active and discontinued stations.

The first gridded time series of monthly rainfall maps was published in 2016 by Frazier et al. and covered the period 1920 to 2012 (Figure 3). In 2019, Longman et al. published a set of daily rainfall (and temperature) maps covering the period 1990 to 2014. In 2022, Lucas et al. published an updated set of monthly rainfall maps covering the period 1990 to 2019. Finally, in 2022 the HCDP was officially launched (publication in preparation), where methods by Lucas et al., are used in the production of near-real-time rainfall maps. The complete time series of maps 1920 to the most recent complete month are available for visualization and download through the HCDP.

Near-Real-Time Mapping
One of the most unique features of the HCDP is its capability for near-real time data acquisition, data quality control, and product generation. Having access to high-quality data and products in near-real-time creates a range of opportunities including; the investigation of recent historical events (e.g. recent floods or a recent heat wave); the development of decision support tools (e.g. near-real time fire risk and warning), and for several educational purposes and community outreach.
The near-real-time workflow is as follows. 1) Data are acquired from electronic sources, 2) Data are standardized into the same format and time step, 3) Outliers are flagged and removed using a machine learning approach, 4) Gap-filling is done at the daily time step, 5) Data are aggregated to the monthly time step, 6) Data are spatially interpolated using an optimized geostatistical, climatological approach, 7) Provisional near real time rainfall maps and associated error metrics are available through the HCDP, 8) Latent (delayed) data are ingested into the HCDP and steps 2-6 are repeated, 9) Archival data product and associated error metrics are made available through the HCDP (Figure 4).
