Visualize Data Tutorial – Download a Map
This guide will walk you through the Visualize Data feature of the HCDP and show you how to download a map.
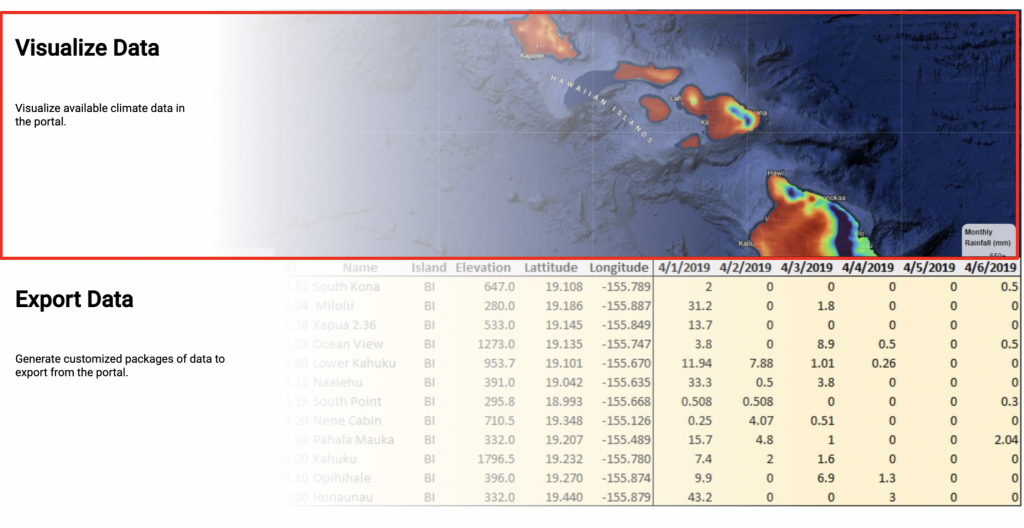
Overview
The left side displays the map. The right side displays the data set section.
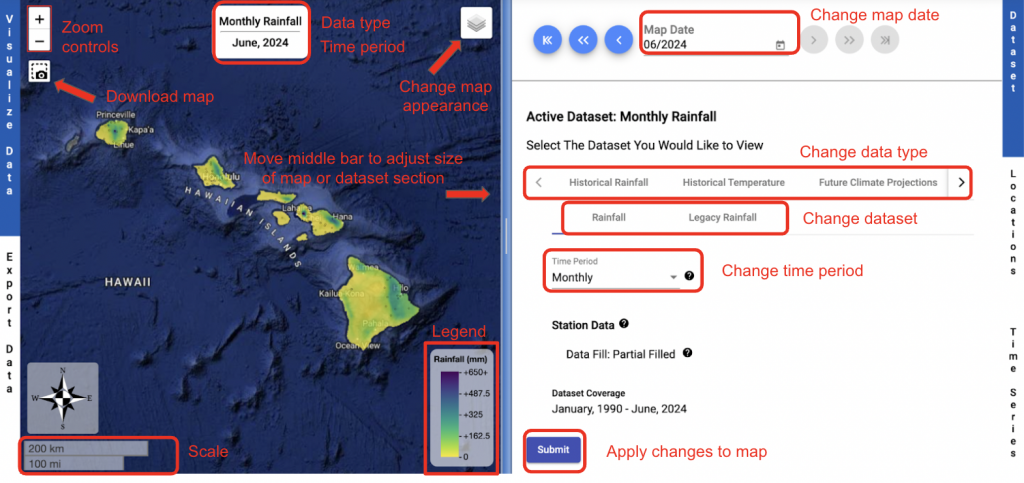
1. Map Navigation
There are several ways to go to a desired location on the map:
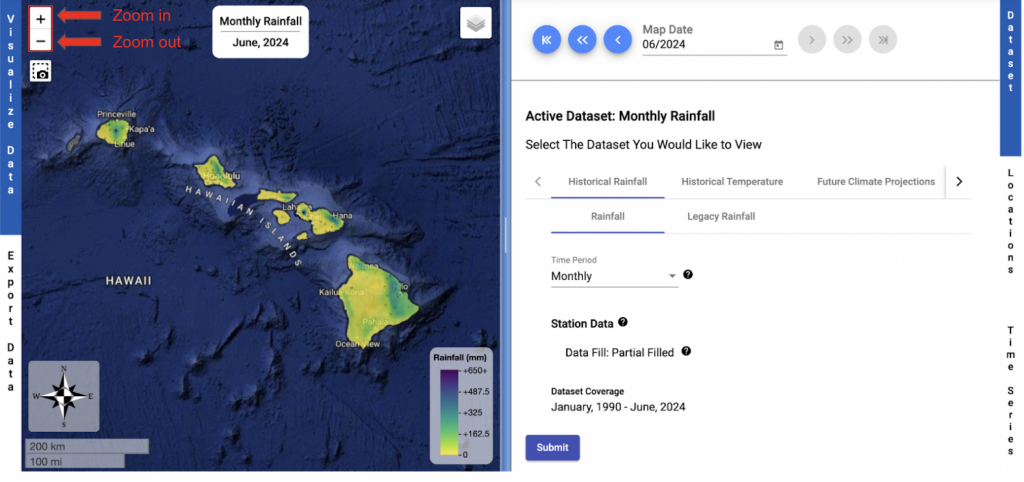
- The plus and minus buttons at the top left of the map will zoom in and out of the map.
- You can also zoom in and out by scrolling with your mouse or trackpad.
- Double clicking on the map will zoom in.
There are 2 ways to pan around the map:
- Use your mouse to click and drag the screen.
- Use your keyboard arrows to move the screen around.
2. Select Variable and Timestep
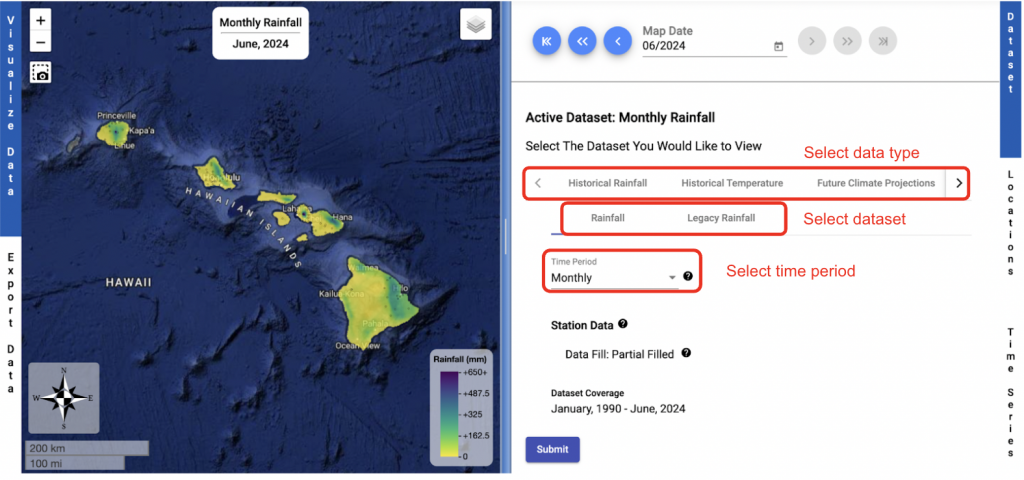
The data type and time period can be changed by clicking on the dropdown bars
3. Select Map Date
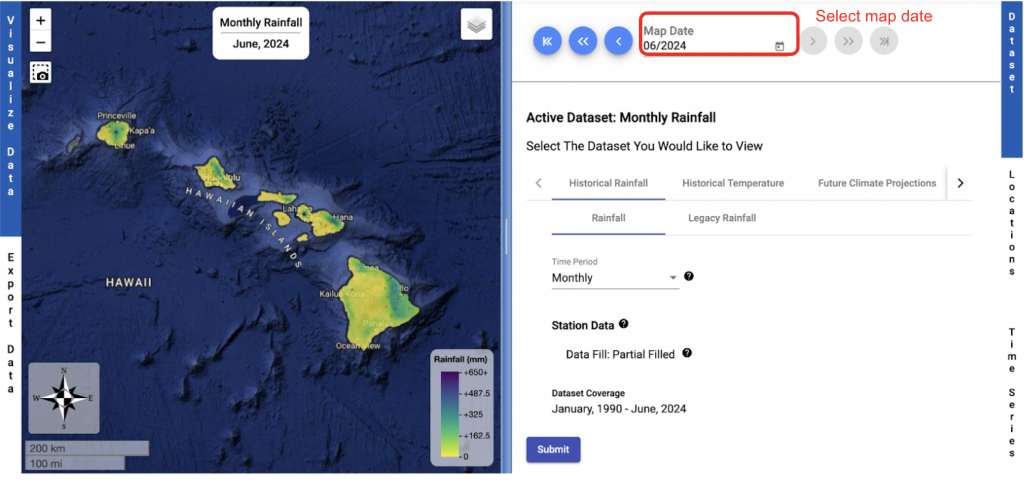
The date of the displayed data can be changed by clicking the map date and by selecting the desired date or by using the arrows.
4. Adjust Map Attributes
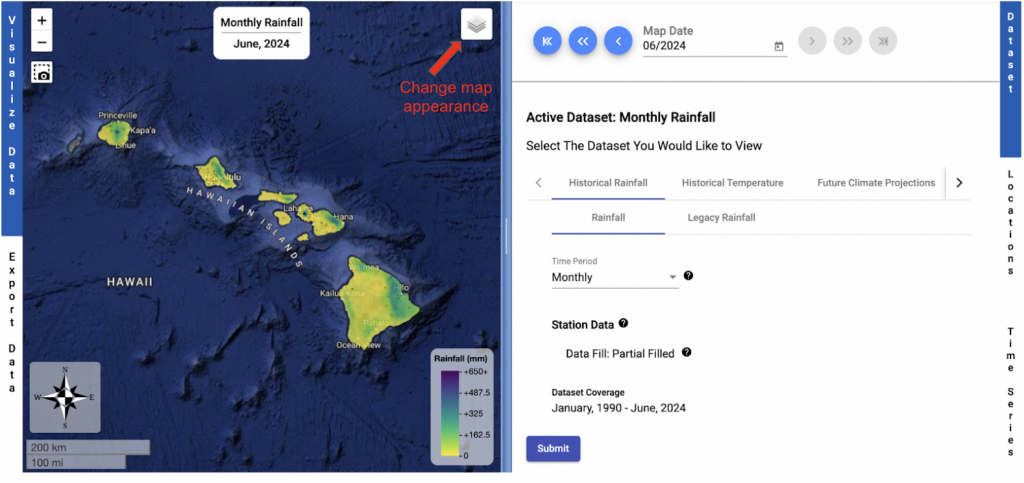
The square on the top right corner of the map can be used to adjust the layers and visuals on the map.
4a. Change Base layer
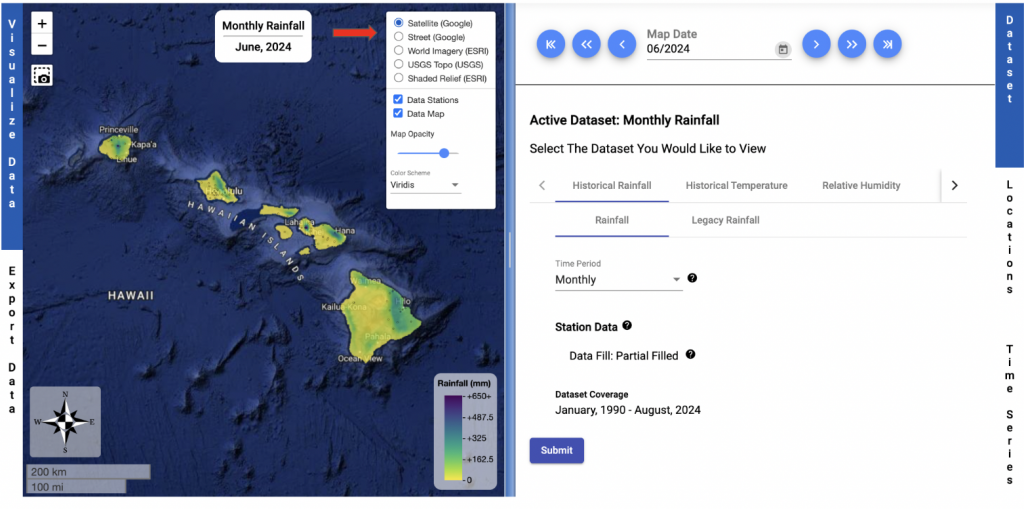
Satellite or Street can be selected as the base layer of the map.
4b. Adjust Opacity, and Visualizations

The rainfall or temperature map and the rainfall or temperature stations can be deselected.
If the rainfall or temperature map is selected, the opacity of the map can be changed by using the slide bar.
4c. Change Color Scheme
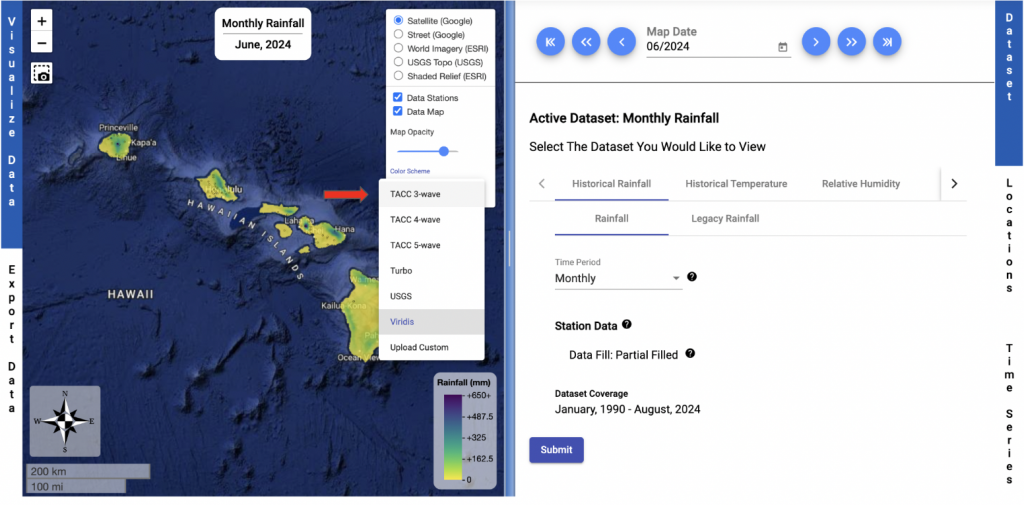
The color scheme of the map can be changed by clicking on the drop down bar and selecting the desired color scheme.
5. Resize and Download Map
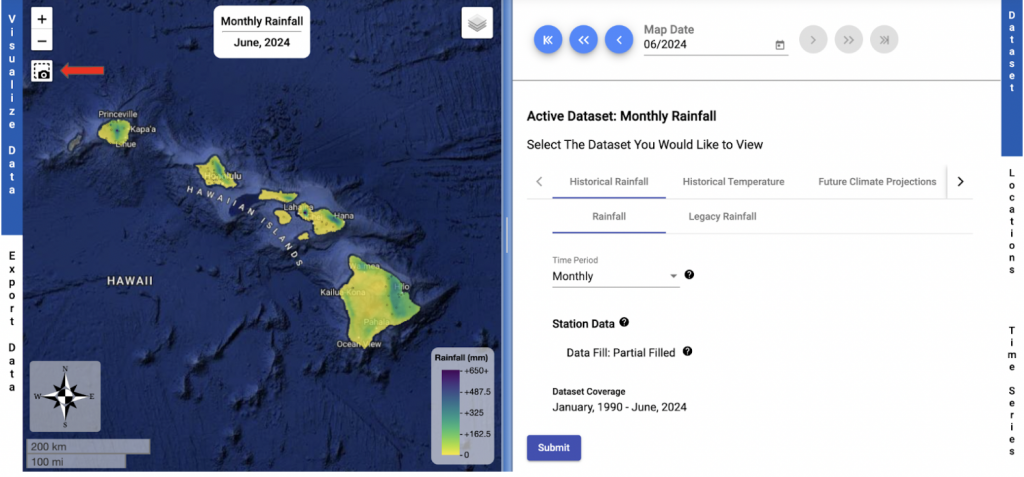
Once the map has desired appearance, click the download button to download a PNG of the map. Note: The dimensions of the map image will change if the slider in the middle of the page is moved to make the map section smaller or larger. You may need to adjust your browser in combination with the slider to get the desired map extent.